Kurssi: Single-cell RNA-seq data analysis with Chipster, Osio: 11. Integrated analysis of multiple samples | csc

Kurssin etusivu
  • About the course

    Course contents

    In this course, you will learn how to analyse single-cell RNA-seq data using the Seurat single-cell tools integrated in the easy-to-use Chipster software. The exercises and course data are based on the Seurat guided analyses "Guided tutorial - 2700 PBMCs" and "Introduction to scRNAseq integration".

    This course contains two types of lecture videos: short lectures on each topic by trainers from CSC (ELIXIR-FI), and more in-depth lectures by Paulo Czarnewski (NBIS / ELIXIR-SE), Ahmed Mahfouz (LUMC / ELIXIR-NL) and Jules Gilet (ELIXIR-FR).


    You will learn the following topics, and how to perform these steps in the Chipster software:
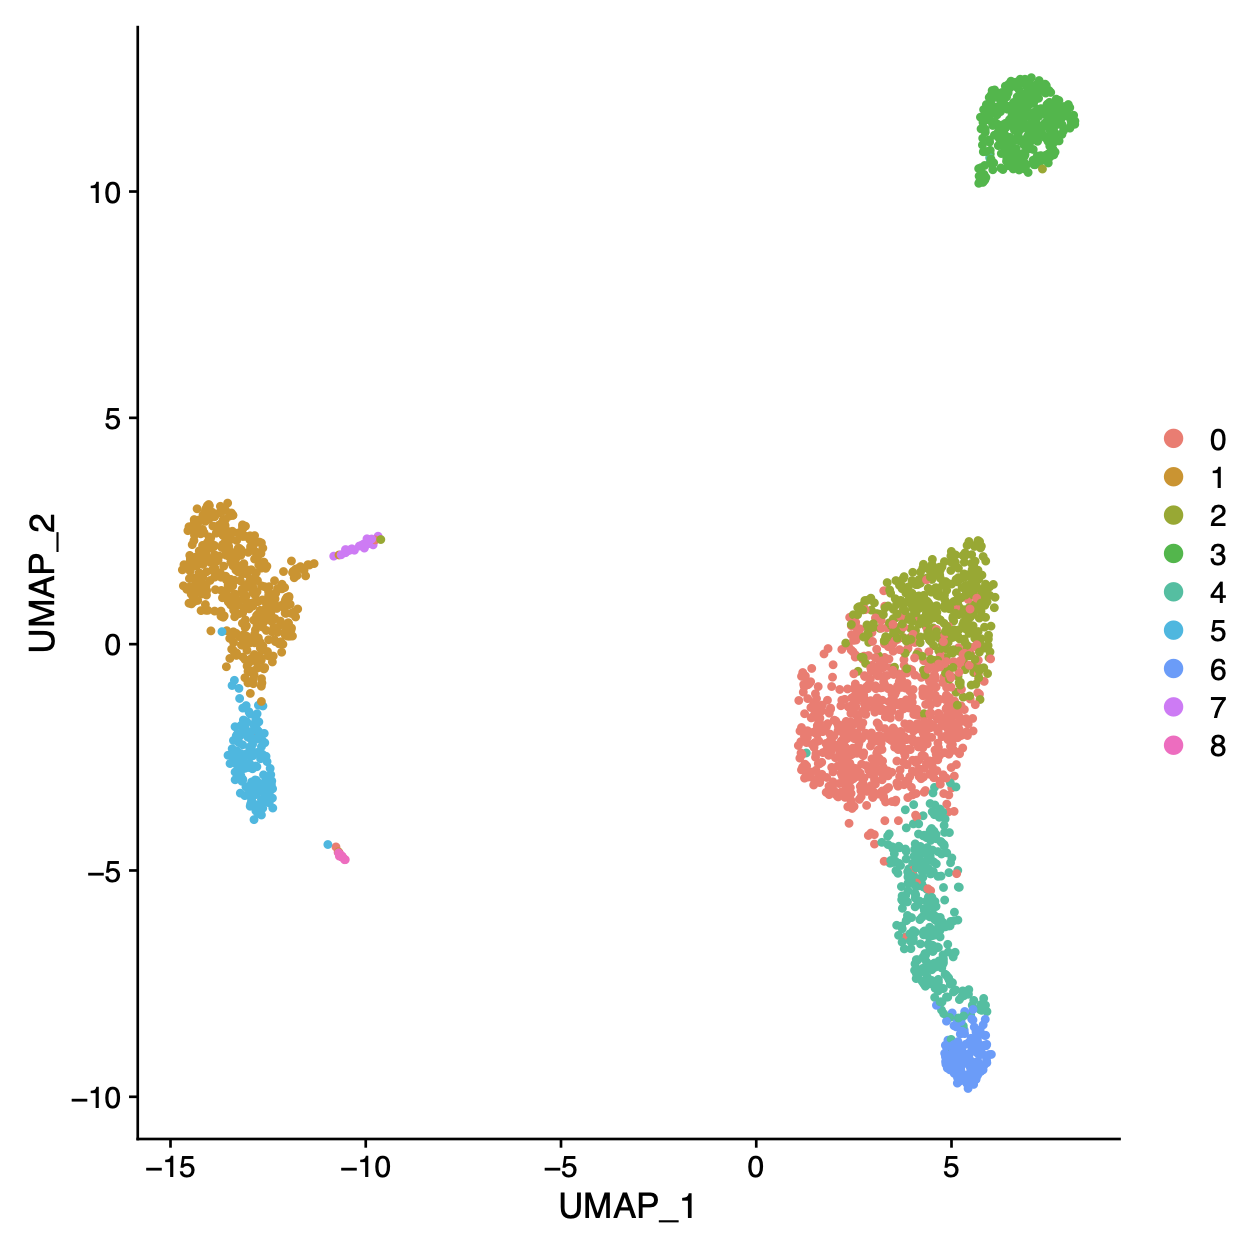
    • UMAP plot showing how cells (dots) are clusteredperform quality control and filter out low quality cells
    • normalize gene expression values (with global scaling normalization and SCTransform)
    • scale data and remove unwanted sources of variation
    • select highly variable genes
    • perform dimensionality reduction (PCA, tSNE, UMAP, CCA)
    • cluster cells
    • find marker genes for a cluster
    • annotate cells and clusters using a reference data
    • take a closer look at the Seurat objects
    • integrate two samples
    • find conserved cluster marker genes for two samples
    • find genes which are differentially expressed between two samples in a cell type specific manner
    • visualize genes with cell type specific responses in two samples

    "It is so nice to be able to do the whole workflow in Chipster, compared to the old model, where I had to transfer the tsv file to R-studio and run Seurat there. -- I learned how to use the Seurat tools in Chipster and what all the steps really mean. I learned to check the results after every step to adjust the next steps parameters and to test different PCA plotting tools. I also learned how to find different genes in the clusters and how to visualize them. I never got this far using the R-pipeline. " -Pinja, course participant & PhD student from University of Helsinki


    Learning objectives

    After this course you should be able to:

    • use the Seurat tools available in Chipster to undertake basic analysis of single-cell RNA-seq data
    • name and discuss the different steps of single-cell RNA-seq data analysis
    • understand the advantages and limitations of single-cell RNA-seq data analysis in general and in Chipster

    Keywords: Chipster, Seurat, single-cell sequencing, RNA-seq, clustering, aligning cells, cluster markers


    Links to material
    The relevant material is linked in each course section. Here are some quick links:


    Practicalities
    Each section of this course contains lecture videos, hands-on exercises and questions/tasks. The tasks can be used to confirm that you have reached the learning goals. You can use the Q&A Forum below to ask questions regarding the course topics or the exercises. Once you have finished all the tasks, you can download a course certificate with a unique course identifier. You can follow your progress with the progress bar on the right. The estimated time to complete the course is 2-3 days. In the certificate we recommend granting 1 credit (ECTS) for the course.  


    Help
    In practical matters, please contact event-support (at) csc.fi, and in content related questions, chipster (at) csc.fi. You can also join the Weekly CSC research user meetings in Zoom to discuss course matters and get help with the exercises.

11. Integrated analysis of multiple samples

  • 11. Integrated analysis of multiple samples

    In this session we demonstrate the use of Seurat tools for joint analysis of two samples. The session uses the same data and follows the steps in Seurat tutorial for integrated analysis

    The tools in Chipster do allow analysis of more than two samples as well. To see how this is done, see example session "02_single_cell_seurat_covid_6samples".

    Now, however, we begin with two expression matrixes: one for control PBMC cells, and another for PBMC cells stimulated with interferon beta. So now the cells will cluster based on cell type, but also based on the treatment, which makes the analysis a bit more complex. 

    We wish to: 

    • Identify cell types that are present in both datasets 
    • Obtain cell type markers that are conserved in both control and stimulated cells 
    • Compare the datasets to find cell-type specific responses to stimulation

    The first steps of the analysis are already familiar to us. After we have preprocessed both samples, we combine them, perform the integrated analysis, find markers for samples and for clusters, and visualise these.

    The process of integrating samples is described in more detail in Methods section in the paper by Stuart*, Butler*, et al., Cell 2019. (You can access the paper in bioRxiv)

    Please watch the video for introduction to two sample analysis:


    We are switching to another dataset and another Chipster session, with two samples.

    Please go through these exercises:

    1. Open example session
    Click Sessions and open training session course_single_cell_RNAseq_Seurat_integrated.

    2. Setup Seurat object & quality control
    Select the immune_control_expression_matrix.txt.gz. Select tool Single-cell RNA-seq / Seurat -Setup and QC. Check the parameters, and name your project as PBMC_CTRL and your sample as CTRL. You can give a bit stricter parameter for filtering (genes expressed at least in 5 cells for example). Make sure that you have assigned the file correctly: this is a digital expression matrix (DGE table) in tsv format. Run the tool.
    Repeat this step for the immune_stimulated_expression_matrix.txt.gz, except now name the sample as STIM. Naming the samples at this point is very important!
    How many cells are there in this dataset? Do you notice anything odd?

    3. Filtering, regression and detection of variable gene
    Select both setup_seurat_obj.Robj objects. Select the tool Single-cell RNA-seq / Seurat - Filter cells, normalize, regress and detect variable genes. Adjust the parameters so that you are filtering out cells that have less than 500 genes expressed, and run the tool ("Run Tool for Each File"). 
    Once the tool is done, open the Dispersion_plot.pdf files.
    How many variable genes are there? Are the most variable genes similar in the two samples? Do you think the filtering parameters we used here work well for this data?

    4. Combine two samples

    Select both seurat_obj_preprocess.R objects from the previous step and run the tool Single-cell RNA-seq / Seurat –Combine multiple samples -this time only once, so choose the option "Run tool (1 sample)".


    Please watch the video for aligning multiple samples and clustering:


    For more theory, you can view the lecture video by Ahmed Mahfouz (slides):


    Then go through these exercises:

    5. Integrated analysis of two samples

    Select the seurat_obj_combined.Robj from the previous step. Run the tool Single-cell RNA-seq / Seurat –Integrated analysis of multiple samples with default parameters.

    While waiting, you can study the manual (click More info...). What are the main steps of this tool?

    When the results are ready, study the integrated_plot.pdfHow many clusters are there in this data?


    Please watch the video for finding differentially expressed genes and conserved cluster markers:


    Then go through these exercises:

    6. Find conserved cluster markers and DE genes in two samples
    Select the seurat_obj_combined_integrated.Robj from the previous step. Run tool Find conserved cluster markers and DE genes in multiple samples for a cluster of your interest (for example, cluster 3). Inspect the tables generated by the tool.
    What was used as a cut-off for the adjusted p-value?
    How many differentially expressed genes were there between the two samples in this cluster? Write down few interesting genes from the list for the visualization exercise 7.
    How many conserved biomarkers were recognized for the cluster? Write down few interesting genes from the list for the next tool.

    7. Visualize markers and differentially expressed genes
    Choose seurat_obj_combined_integrated.Robj generated in step 5. Select tool Single-cell RNA-seq / Seurat - Visualize genes with cell type specific responses in multiple samples. Type the gene names to the parameter field (the ones you listed in previous step, or try for example: CD3D, GNLY, IFI16, ISG15, CD14, CXCL10). Use comma (,) as a separator. You can run the tool several times for different gene lists.
    Open split_dot_plot.pdf.
    Are the differentially expressed genes expressed differently also in other clusters? Are the conserved markers expressed in other clusters?